
What is A/B testing in marketing?
“It gives you the data you need so you can step away from taking a shot in the dark and use real information to sharpen your campaigns, improve engagement, and connect with your audience.” — Espinal, Email marketing expert at Litmus, specialist in A/B testing for email campaigns
A/B testing in marketing is a controlled experiment where two versions of a digital asset are compared to determine which performs better against specific success metrics. The methodology, also known as split testing or bucket testing, involves creating a control version (A) and a variant version (B) that differ in one deliberate element. Marketers then measure the impact on user behavior, engagement, and conversion rates to identify the most effective approach.
The process operates by randomly dividing an audience into two segments, with each group exposed to a different version of the tested element. Version A represents the original experience, while Version B incorporates a single modification such as altered button color, revised headline, or adjusted form length. Unlike multivariate testing, which examines multiple variables simultaneously, A/B testing focuses on incremental, data-driven changes to one element at a time. This singular focus enables teams to isolate the specific impact of each modification without overwhelming complexity.
The fundamental value of A/B testing lies in its ability to replace subjective decision-making with objective, quantitative data. Every digital experience contains numerous variables—headlines, images, calls-to-action, layouts, user flows—and each represents a hypothesis about what will best serve users and business objectives. By rigorously testing these hypotheses in a controlled environment, teams validate their ideas and learn from both successes and failures based on actual user behavior rather than instinct or opinion.
Statistical significance measures the probability that observed outcomes represent genuine effects rather than random chance. For example, if a test shows a 5% increase in conversion rate with 90% confidence, marketers can be 90% certain the results are trustworthy. This data-driven approach fosters a culture of experimentation where even strongly held opinions can be challenged and refined by empirical evidence.
Common applications include website headlines, calls-to-action, email subject lines, ad copy, images, landing page layouts, and pricing models. Organizations that embed A/B testing systematically experience greater innovation as the risk of implementing ineffective ideas decreases, along with higher ROI since negative concepts can be eliminated before full deployment.
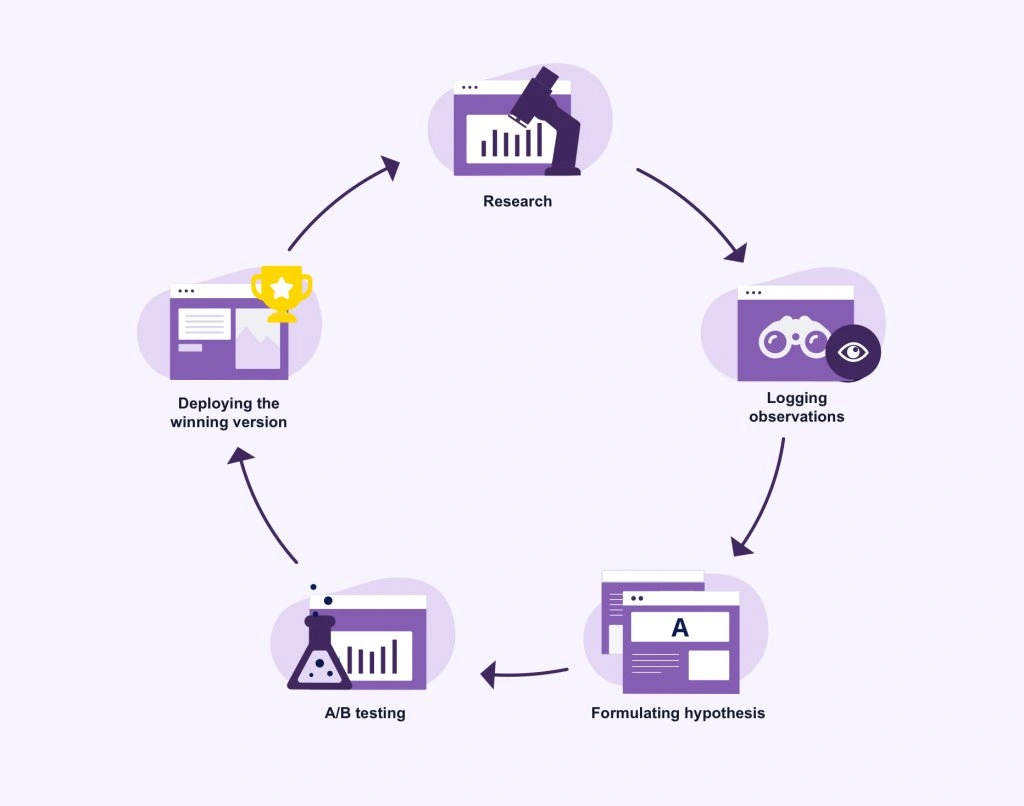
How to run an A/B test
Running an effective A/B test requires a structured methodology that transforms subjective opinions into measurable outcomes through systematic execution.
Create a hypothesis
A hypothesis establishes the foundation for any test by articulating a clear, testable prediction about how a specific change will impact a defined metric. The statement should follow a structured format: “Changing [element] from [current state] to [proposed state] will increase/decrease [measurable outcome]”. This format distinguishes between an idea (what to change) and a hypothesis (why the change will produce better results). For instance, “Changing the call-to-action button color from gray to red will increase conversions because the button will be more noticeable” represents a complete hypothesis grounded in observable user behavior. The hypothesis must connect directly to business objectives and stem from user research rather than assumptions.
Choose one variable to test
Isolated testing examines one element at a time to establish clear causality between the modification and observed results. Variables available for testing include creative elements (images, text, ad formats), audience segments, placements, or custom configurations. Testing multiple elements simultaneously obscures attribution, making it impossible to determine which specific change drove performance differences. Starting with a single variable provides the clearest insight into how modifications affect outcomes.
Split your audience evenly
A 50/50 traffic distribution between control and variant produces optimal variance reduction and maximizes statistical power, enabling tests to reach significance faster than uneven splits. This even allocation ensures audiences remain statistically comparable and avoids the inflated denominators that occur with imbalanced ratios.
Set a time frame
Tests require a minimum duration of one to two weeks to account for behavioral fluctuations across different days and capture representative samples. While some platforms permit tests up to 90 days, most tests conclude within four weeks.
Measure results against your goal
Define primary metrics that directly indicate whether the variant achieved the intended behavioral change, supplemented by guardrail metrics that verify positive business impact. Statistical significance thresholds, typically set at 95%, determine result reliability.
What elements should you A/B test?
Digital marketing campaigns contain numerous testable components, each offering opportunities to optimize performance through systematic comparison.
Email subject lines and CTAs
Email campaigns benefit from testing subject lines across multiple dimensions: length variations, personalization inclusion, question formats versus declarative statements, and clever phrasing versus clear value propositions. Call-to-action buttons require examination of wording, color, size, and placement. Additional variables include preheader text, email content formatting, imagery, and delivery timing.
Landing page headlines and buttons
Headlines warrant testing across benefit-focused versus feature-focused copy, emotional versus neutral tone, curiosity-inducing questions versus direct statements, and length variations. CTA button optimization involves experimenting with placement above or below the fold, single versus multiple instances throughout the page, color contrast, and positioning relative to benefit sections or social proof.
Ad copy and images
Advertisement creative testing encompasses imagery selection between lifestyle shots and product photography, emotional sentiment variations, copy length and structure, background colors, and format types such as single image versus carousel. CTA verbs like “Buy,” “Shop,” or “Get” produce different response rates.
Forms and checkout pages
Form optimization requires testing field quantity, multi-step versus single-page layouts, required versus optional fields, placeholder text presence, and submit button copy. Checkout processes benefit from testing guest checkout availability, trust badges, security messaging, customer support options, and step progression structure.
A/B testing examples that increased conversions
“A/B testing is a powerful tool for any brand or lifecycle marketer, providing data-driven insights to optimize your marketing strategy and platform performance.” — Melia Dion, Senior Lifecycle Strategist at Power Digital, specialist in email A/B testing
Real-world implementations demonstrate measurable performance improvements across industries and test types. **True Botanicals** achieved a $2M+ estimated ROI increase and 4.9% site-wide conversion rate by incorporating social proof elements on product detail pages. In another case, **HP** generated $21M in incremental revenue through nearly 500 experimentation campaigns that included search functionality optimization.
Form simplification produced substantial gains for multiple organizations. DocuSign increased mobile conversion rates by 35% after removing non-essential form fields from their sign-up process, while PayU registered a 5.8% conversion improvement by eliminating the email address field from checkout forms. SeaWorld Parks & Entertainment reduced bottom-of-funnel failure rates by 50% through ticket purchase funnel optimization.
Personalization strategies yielded significant returns. Visa experienced a 20% conversion rate increase by serving tailored content based on user segments, and News UK achieved a 39% rise in digital subscription conversions through personalized content recommendations. Brooks Running demonstrated trust-building impact with an 80% decrease in return rates following personalized customer service implementation.
Traditional commerce elements remained powerful testing opportunities. FSAstore.com saw a 53.8% revenue per visitor increase after simplifying site navigation, while Grene doubled total purchase quantity by redesigning their mini cart interface. Hyperice increased conversion rates by 6.2% through product comparison features.
FAQs
Q1. What exactly is A/B testing and why should marketers use it? A/B testing is a controlled experiment that compares two versions of a digital asset to determine which performs better. It allows marketers to make data-driven decisions rather than relying on guesswork, helping improve engagement, conversions, and overall campaign effectiveness by testing one element at a time and measuring real user behavior.
Q2. How long should I run an A/B test to get reliable results? Most A/B tests should run for a minimum of one to two weeks to account for behavioral fluctuations across different days and capture a representative sample of your audience. While some tests can run up to 90 days, the majority conclude within four weeks to balance statistical significance with timely insights.
Q3. Can I test multiple elements at the same time in an A/B test? No, you should only test one variable at a time in an A/B test. Testing multiple elements simultaneously makes it impossible to determine which specific change caused the performance difference. This isolated approach ensures clear causality and provides actionable insights about what actually drives results.
Q4. What are the most important elements to A/B test in email marketing? The most impactful elements to test in email campaigns include subject lines (length, personalization, questions vs. statements), call-to-action buttons (wording, color, size, placement), preheader text, email content formatting, imagery, and send timing. These components directly influence open rates and click-through performance.
Q5. How do I know if my A/B test results are statistically significant? Statistical significance is typically set at a 95% confidence level, meaning you can be 95% certain the results represent genuine effects rather than random chance. You should also ensure an even 50/50 traffic split between versions and measure results against clearly defined primary metrics that indicate whether your variant achieved the intended behavioral change.
People also read: Carla Diab Net Worth 2026: The Untold Story Behind Her Fashion Empire